

How to Solve Graphs on the SAT ELA: A Complete Guide for Students
SAT ELA graph questions test more than your ability to read charts. Learn how to identify study variables, interpret percentages and correlations, recognize misleading labels, and connect graph data to a passage with confidence.

SAT ELA graph questions can be deceptively difficult. At first glance, they seem simple: look at a graph, identify a trend, and choose the answer that describes it. But the SAT rarely makes the task that straightforward.
You might encounter a complicated scientific study, a table filled with unfamiliar terminology, or a graph whose labels are easy to misinterpret. You may need to understand what researchers measured, what they changed, and what their results actually demonstrate. Sometimes, the correct answer depends on noticing a small detail in the passage that completely changes how you interpret the data.
The good news? These questions become much more manageable when you have a systematic approach.
The secret to learning how to solve graphs on the SAT ELA is not simply memorizing how to read charts. It is learning how to reconstruct the study behind the data, identify the information that matters, connect the graph to the passage, and recognize what the evidence does, and does not, prove.
Here are the strategies that can help you approach SAT graph questions with greater confidence.
1. Understand What SAT ELA Graph Questions Are Really Testing
SAT Reading and Writing graph questions often appear in passages about scientific research, experiments, and economic or social trends. You might encounter studies involving animal behavior, materials, scientific models, or public policy.
These questions are not simply testing whether you can read numbers. They are testing whether you can understand the research behind those numbers and interpret evidence accurately.
For example, imagine a table comparing different studies of cougar populations. The table might include:
- The locations where researchers conducted their studies
- The methods used to track cougar populations, such as radio collars, dogs, camera traps, or helicopter surveys
- The results of each study
- The maximum population density recorded
A student who immediately tries to memorize every detail may become overwhelmed. A stronger reader first asks: What were the researchers trying to investigate?
In this example, the researchers appear to be comparing tracking methods. The locations and methods provide context, while the results show what the researchers found.
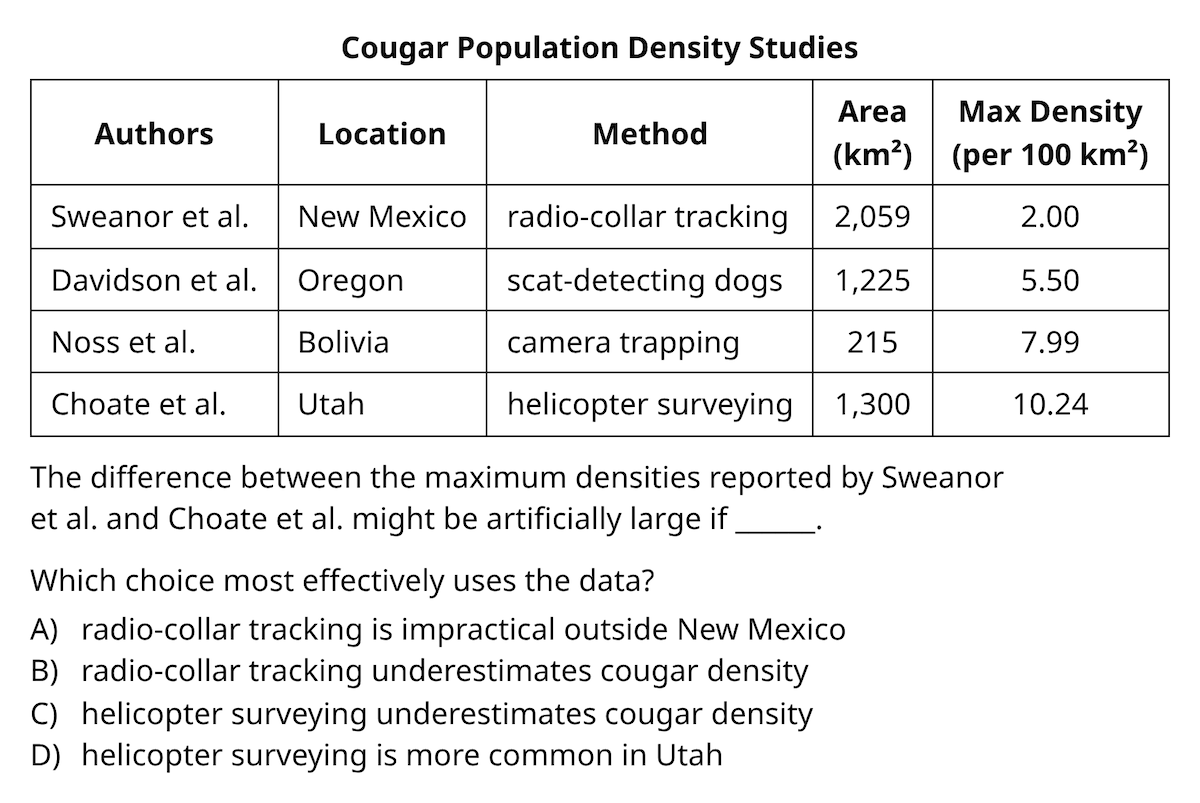
That basic understanding gives you a framework for interpreting the information, even before you read the entire passage. Also check out our complete SAT preparation guide.
2. Reconstruct the Study Before Interpreting the Graph
One of the most effective strategies for solving SAT graph questions is to tell the story of the study.
Imagine looking at a graph without having read the passage. Before worrying about individual numbers, ask yourself:
- What is being studied?
- What did the researchers change or compare?
- What did they measure?
- What do the results show?
This process helps you understand the structure of the data instead of getting distracted by every label and number.
Identify the independent and dependent variables
Two scientific terms are especially useful:
- Independent variable: What the researchers changed, selected, or compared.
- Dependent variable: What the researchers measured.
A simple way to remember the distinction is:
Independent = what they decided. Dependent = what they measured.
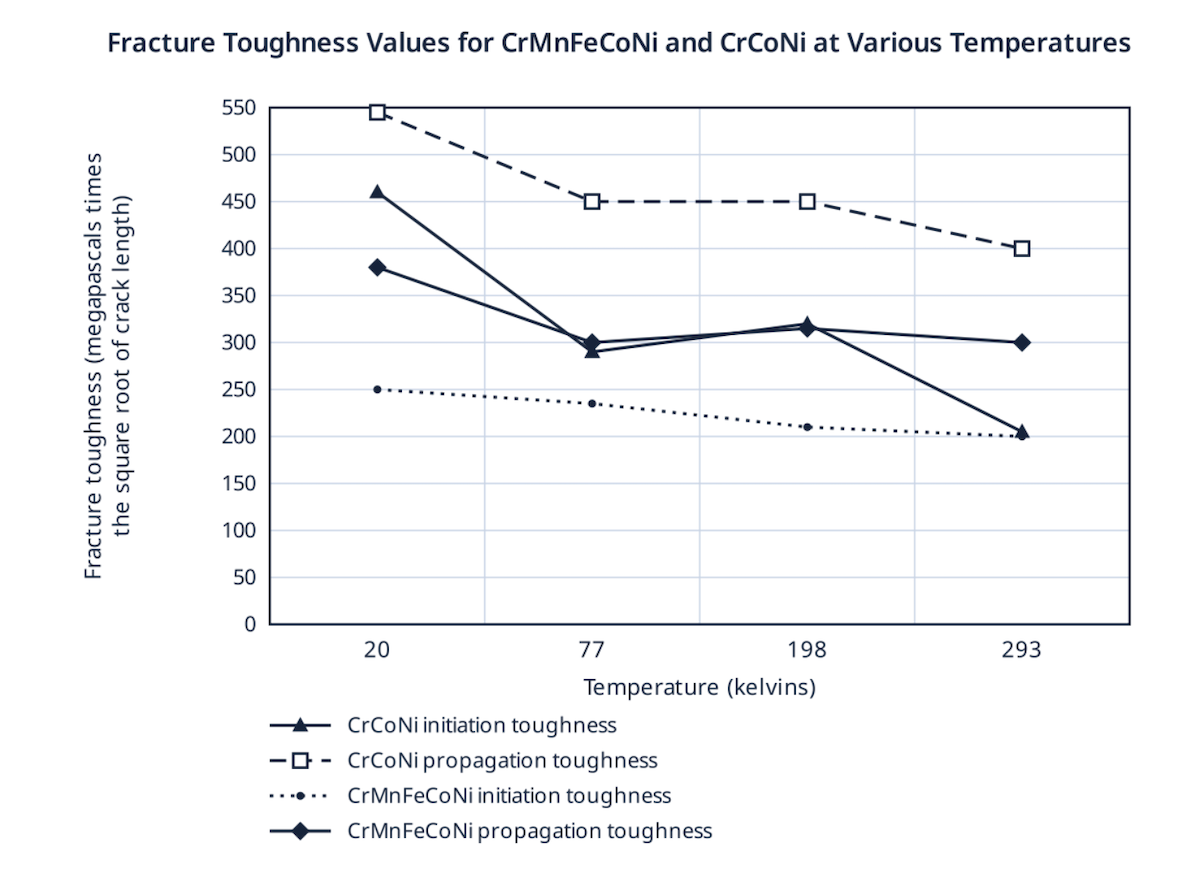
For example, imagine a study measuring the fracture toughness of different materials at different temperatures.
The researchers varied the temperature and measured fracture toughness. Temperature is the independent variable and goes on the x-axis, while fracture toughness is the dependent variable and is displayed on the y-axis. When the student is looking at this table above, they could see that as the temperature is going up, the fracture toughness for all.
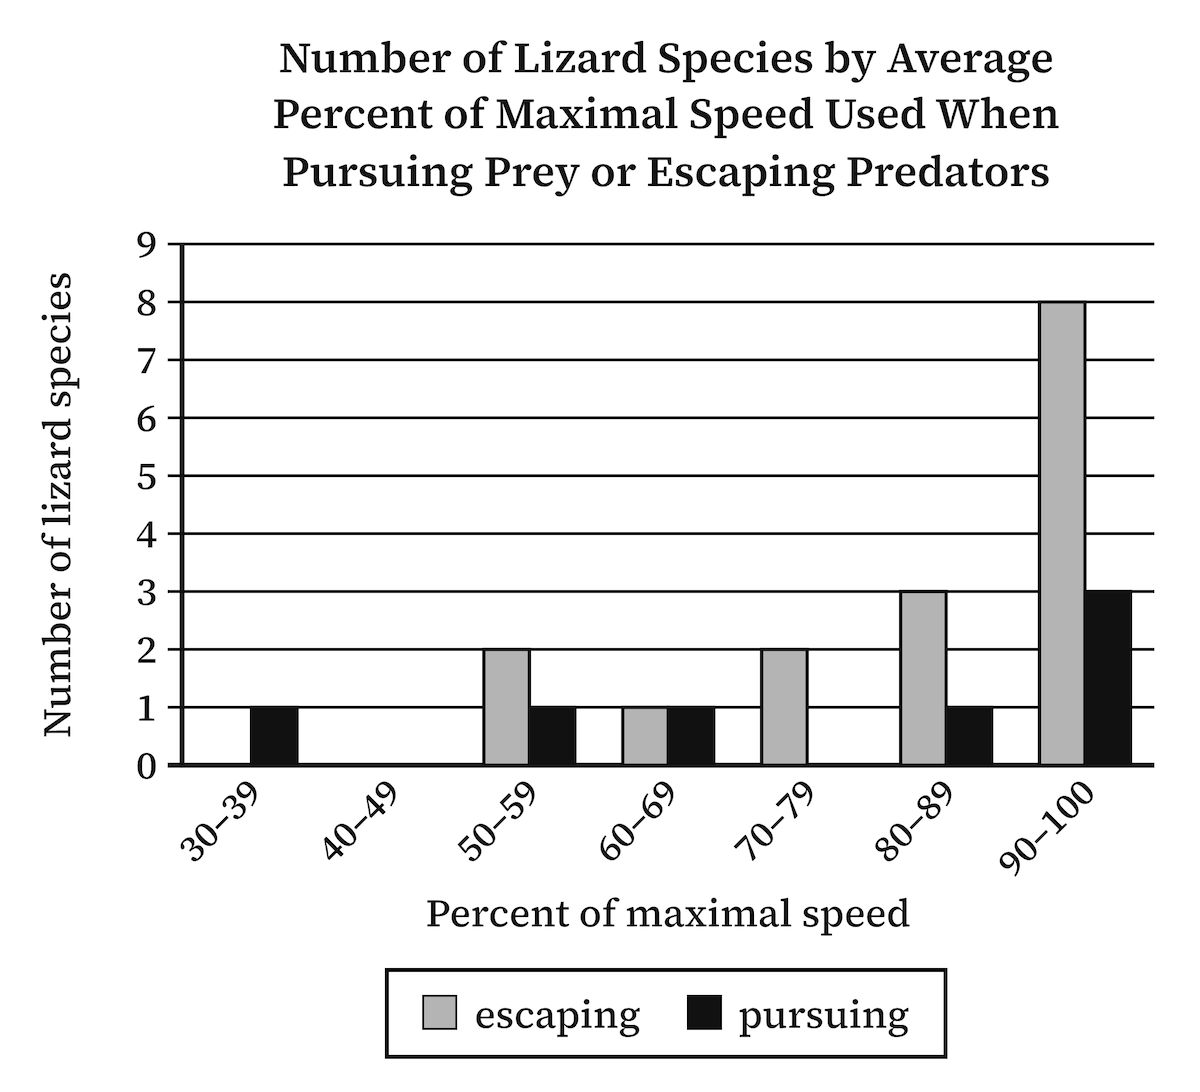
The same logic applies to a study of lizards. Researchers might compare two situations: pursuing prey and escaping predators. They then measure how much of their maximum speed the lizards use in each situation.
The type of behavior is what the researchers varied (legend) in addition to percent of maximum speed, and the number of lizards using this particular speed is what they measured. Here, we could see that 7 lizards used their maximum speed (90 - 100%) during escaping, while only 3 lizards used the maximum speed during pursuing prey. We can also see that a greaterl number of lizards (2+1+2+3) used various speeds, such as 50-59% of their maximum speed and 60-69% of their maximum speed, while escaping. Therefore, it would be incorrect to say that most lizards use their maximum speed when they feel endangered. .
Once you can explain that relationship, the graph becomes much easier to understand.
Start with the title, axes, and legend
Before diving into the data, examine the graph's title and labels. The title tells you what the study concerns, while the axes and legend explain what the different categories represent.
Pay particular attention to the horizontal and vertical axes:
- The horizontal axis, or x-axis, often shows what researchers varied.
- The vertical axis, or y-axis, often shows what researchers measured.
This is a useful starting point, not a substitute for reading the actual labels. Always check what the graph says rather than assuming that the axes follow a familiar pattern.
Your goal is to describe the study in plain English. If you can tell someone what the researchers compared and what they measured, you are already in a much stronger position.
3. Understand the Scientific Process Behind the Data
Scientific passages become easier to follow when you understand how a study is designed.
A typical scientific process can be broken into five steps:
- Observation: Scientists notice something happening. For example, they observe that it becomes brighter in the morning.
- Hypothesis: They develop a possible explanation for what they observed.
- Study design: They decide how to test the hypothesis. Researchers determine what variable to investigate and try to control other factors so they can isolate the relationship they want to study.
- Conducting the study: Researchers carry out the experiment or investigation. How carefully they conduct it matters. If a treatment is administered inconsistently, for example, it may become difficult to establish a clear cause-and-effect relationship.
- Results and analysis: Researchers organize their findings, analyze the results, and present them in a graph or table.
When you encounter a graph question, you are usually looking at the results and analysis. However, you can work backward to understand the study design.
Ask yourself: What would the researchers have needed to do to produce these results?
This is particularly useful when the passage is complicated. Instead of trying to absorb every scientific detail, focus on the relationship between what the researchers changed and what they measured.
Additionally, it is essential to recognize instances where a study suffers from flawed design or improper execution.
In many standard test questions, students must identify these procedural flaws and experimental design errors, which are frequently highlighted within the answer choices. Consider the following classic example of a study impacted by both design and execution issues:
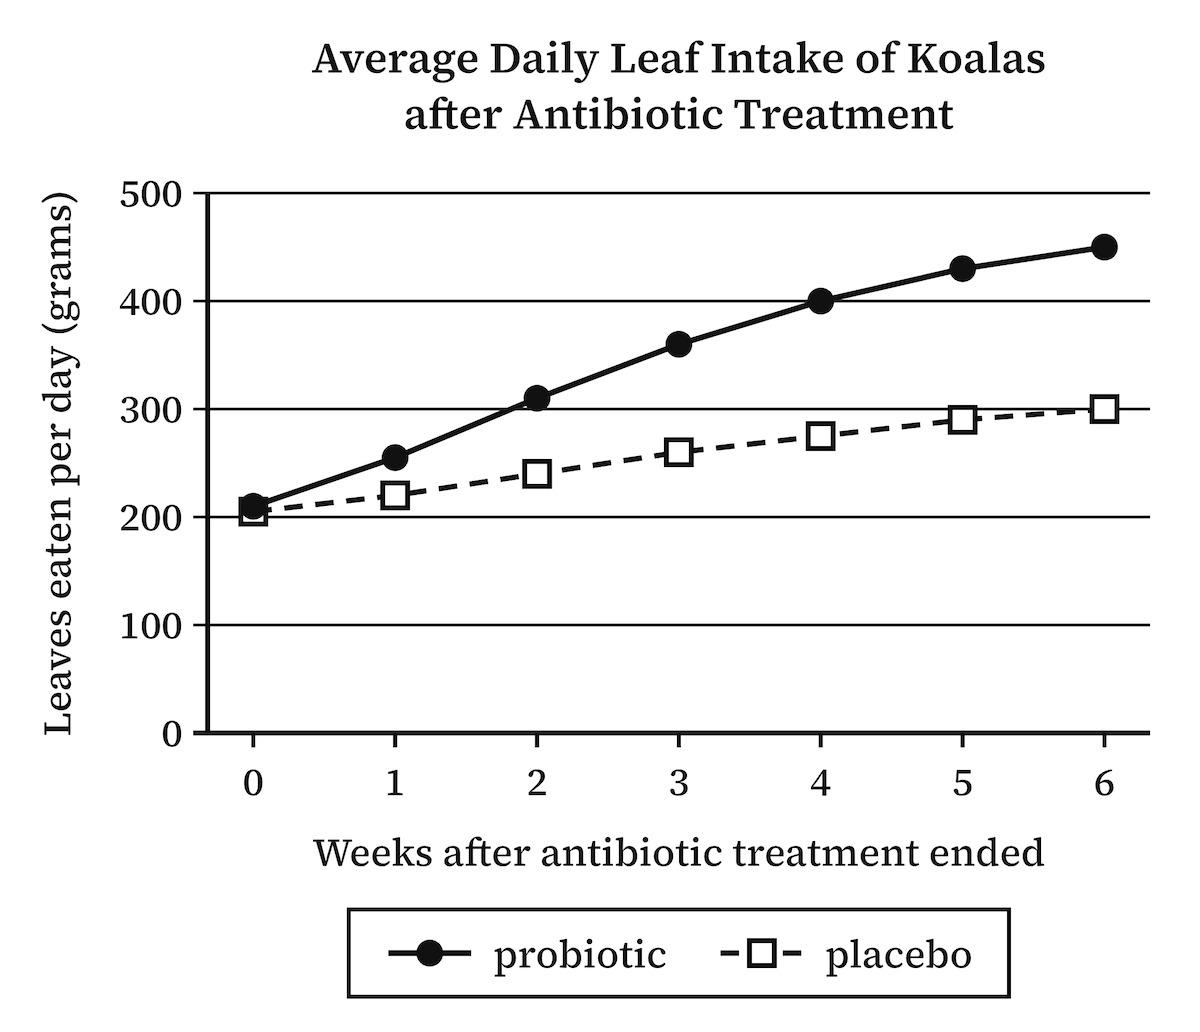
- Observation: Veterinarians at a wildlife hospital notice that koalas treated with antibiotics for chlamydia often eat less afterward.
- Hypothesis: A daily probiotic containing tannin-digesting gut bacteria will help koalas recover after the antibiotics end.
- Study design: Twenty-four koalas finishing antibiotics are randomly split into two groups of 12. One group gets a probiotic paste by mouth syringe every morning; the other gets an identical-looking placebo paste. All koalas are supposed to be housed and fed the same way. Because researchers can’t ask a koala how it feels, they record how many grams of eucalyptus leaves each koala eats per day as a stand-in for recovery.
- Conducting the study: This is where it goes wrong.
- The probiotic has to stay refrigerated, so the probiotic group is moved indoors next to the clinic fridge. Staff there bring them freshly cut leaves twice a day, while the placebo group stays outdoors with one morning delivery.
- Koalas that fight the syringe get the paste smeared on their leaves instead.
- Weekend doses are often skipped because fewer staff are on duty.
- Results: The graph shows the probiotic group rising from about 210 to 450 grams a day, while the placebo group only reaches about 300. The team concludes that the probiotic helped the koalas recover.
The graph looks convincing, but the study behind it doesn’t support the conclusion. First, the probiotic koalas didn’t just get the probiotic. They were also moved indoors, where staff brought them freshly cut leaves twice a day, while the placebo koalas stayed outdoors with one morning delivery. Because two things changed at once, there is no way to tell whether the probiotic or the fresher, more frequent leaves raised their intake. Second, the probiotic was given inconsistently. Some koalas got it by syringe, some had it smeared on their leaves, and some missed weekend doses entirely, so no one knows how much each koala actually received. Worse, when the paste was on the leaves, the koalas that ate more also got more probiotic, so appetite was driving the dose rather than the dose driving appetite. All of this exposes the weakness of the study’s proxy. Researchers can’t ask a koala whether it feels better, so they used leaf intake as a stand-in for recovery. A proxy can only be trusted if the thing you care about is the only thing moving it, and here fresh leaves could push intake up with no change at all in the koala’s gut health. The line on the graph rose, but it may have risen for the wrong reason.
4. Use the Question Stem as Your North Star
A graph can contain an enormous amount of information. Not all of it matters to the question.
That is why the question stem should guide your analysis.
Consider a question that asks:
Which choice best describes data in the graph that supports the scientist's conclusion?
Before analyzing the graph, identify the scientist's conclusion. What exactly did the scientist claim?
If you do not understand the conclusion, you cannot reliably determine which data support it.
You may need to return to the passage to find the relevant sentence. Conclusions often appear toward the end of a paragraph, and important information can be tucked inside parentheses or other peculiar punctuation. Read our 5 Bocks article for more advice on how to improve your SAT reading comprehension.
Pay attention to details inside parentheses or any type of “funny” punctuation.
Watch for unusual punctuation: parentheses, a dash sandwich, a single dash, or a sentence crowded with commas. College Board’s test writers use these marks to slip in a detail the main sentence can’t carry on its own, such as a definition, a qualification, or a distinction, and on the SAT that detail is very often the one the question turns on.
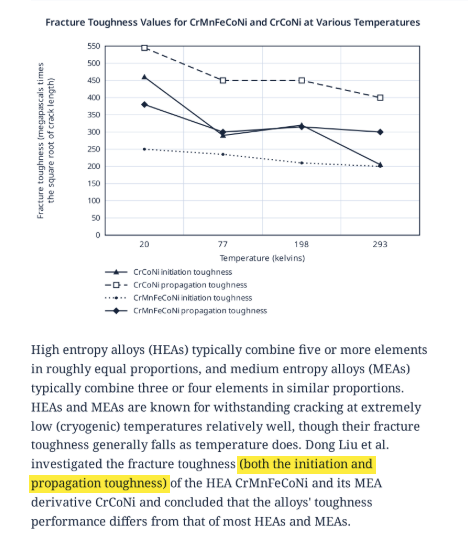
In this passage, the parentheses tell you that Liu et al. measured two different kinds of toughness, initiation and propagation. That’s why the graph has four lines instead of two. A student who skims past the parentheses ends up looking at a graph that doesn’t make sense. So when the punctuation gets funny, slow down, because what it holds is usually something the author wants you to notice.
An alloy's fracture toughness differs from that of most high-entropy alloys (HEAs) and medium-entropy alloys (MEAs), in both initiation and propagation toughness.
The phrase about initiation and propagation toughness matters because it tells you that the conclusion applies to both. You do not necessarily need to compare those two measurements against each other. The distinction is then, of course, irrelevant to the question.
This is a critical skill: knowing what not to focus on.
SAT graphs often include several categories, measurements, and labels that can distract you from the actual task. The question stem tells you which information deserves your attention.
5. Watch for Graphs That Move in Unexpected Directions
Students are accustomed to reading from left to right. As a result, they often assume that a graph should be interpreted in the same direction.
But the SAT can present data in a way that requires you to reverse that instinct.
Consider a graph showing fracture toughness at different temperatures: 293, 77, and 20 degrees.
A student might naturally read the graph from 20 to 293, following the usual left-to-right direction. But the passage may describe what happens as temperature falls.
If the question concerns how a material behaves as temperatures decrease, you must read the data from 293 toward 20.
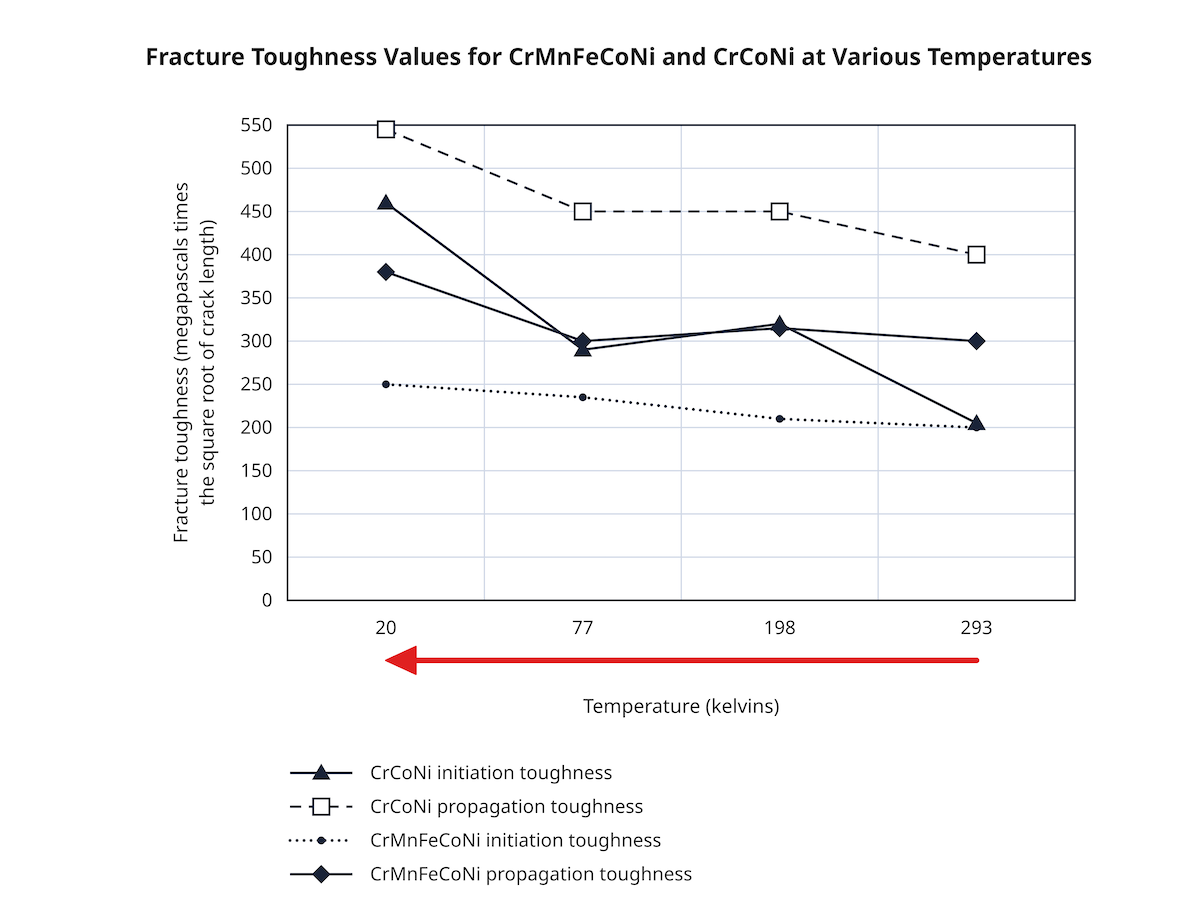
In one example, the passage explains that most HEAs and MEAs generally experience a decline in fracture toughness as temperature falls. However, the graph shows two alloys whose toughness actually increases as the temperature decreases.
That is the important finding.
The graph is not incorrect or misleading. The challenge is that you must interpret the direction of change that the passage describes rather than automatically following the direction in which you are accustomed to reading.
SAT strategy: Whenever a passage describes a change over time, temperature, or another variable, check which direction the question is asking you to follow. Do not assume that left to right is always the relevant direction.
6. Understand What Bar Graphs Actually Show
Bar graphs may look simple, but their labels can completely change what the data mean.
One especially important distinction is the difference between an actual quantity and a proportion or percentage.
Distinguish percentages from actual quantities
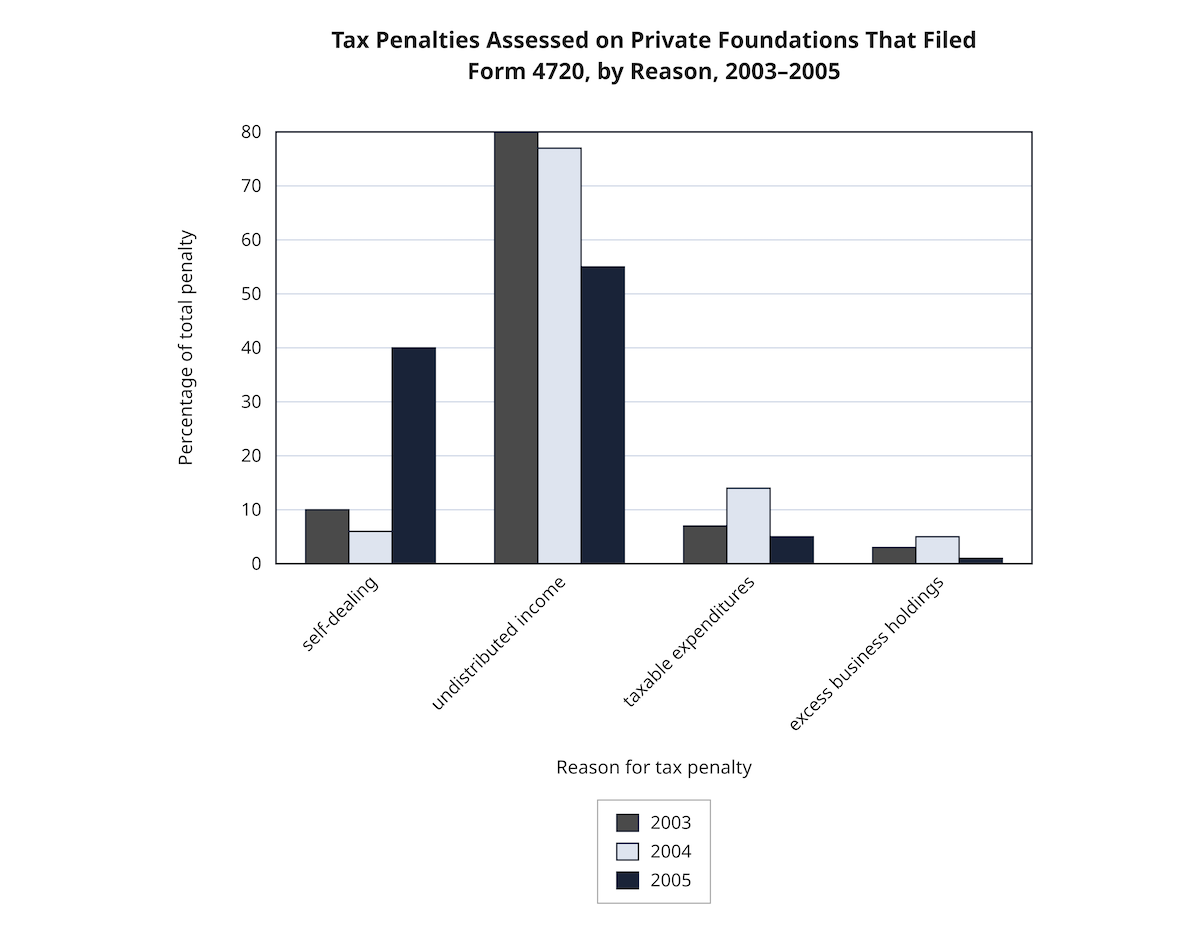
Suppose a graph shows the percentage of total penalties associated with different categories. The categories might include undistributed income, self-dealing, and other types of violations.
If the graph shows that undistributed income accounts for the largest percentage of penalties, what can you conclude?
You can conclude that the largest share of the total penalty amount came from that category.
What can you not conclude?
You cannot conclude that the largest number of people or organizations paid a penalty for that reason.
Why not? Because the graph shows the percentage of the total money, not the number of people involved.
Imagine that three organizations paid enormous penalties, while thousands of other organizations paid much smaller penalties. The category with the largest share of the money would not necessarily involve the largest number of organizations.
This distinction is essential.
When you see words such as percentage, proportion, attribution, or correlation, slow down and examine exactly what is being measured.
Be careful with percentages of a total
Some graphs show categories that together add up to 100%. In these cases, each bar or segment represents a share of a larger whole.
For example, if a graph shows how total penalties were distributed among several categories in a particular year, the percentages describe how the total was divided.
They do not automatically tell you:
- How many organizations were involved
- How many individual violations occurred
- Whether the total amount increased or decreased
- Whether one category involved more people than another
You must stay within the limits of the data.
7. Do Not Confuse Correlation with Quantity or Causation
Correlation is another concept that frequently creates confusion.
Students may remember that positive correlation means two things move in the same direction, while negative correlation means they move in opposite directions. That is useful, but it is not enough.
The first question should always be: What two things are being compared?
A graph might show the correlation between a scientific model's predictions and actual measurements. In that situation, a higher correlation means that the model and the real-world measurements agree more closely.
It does not mean that there is a greater quantity of something.
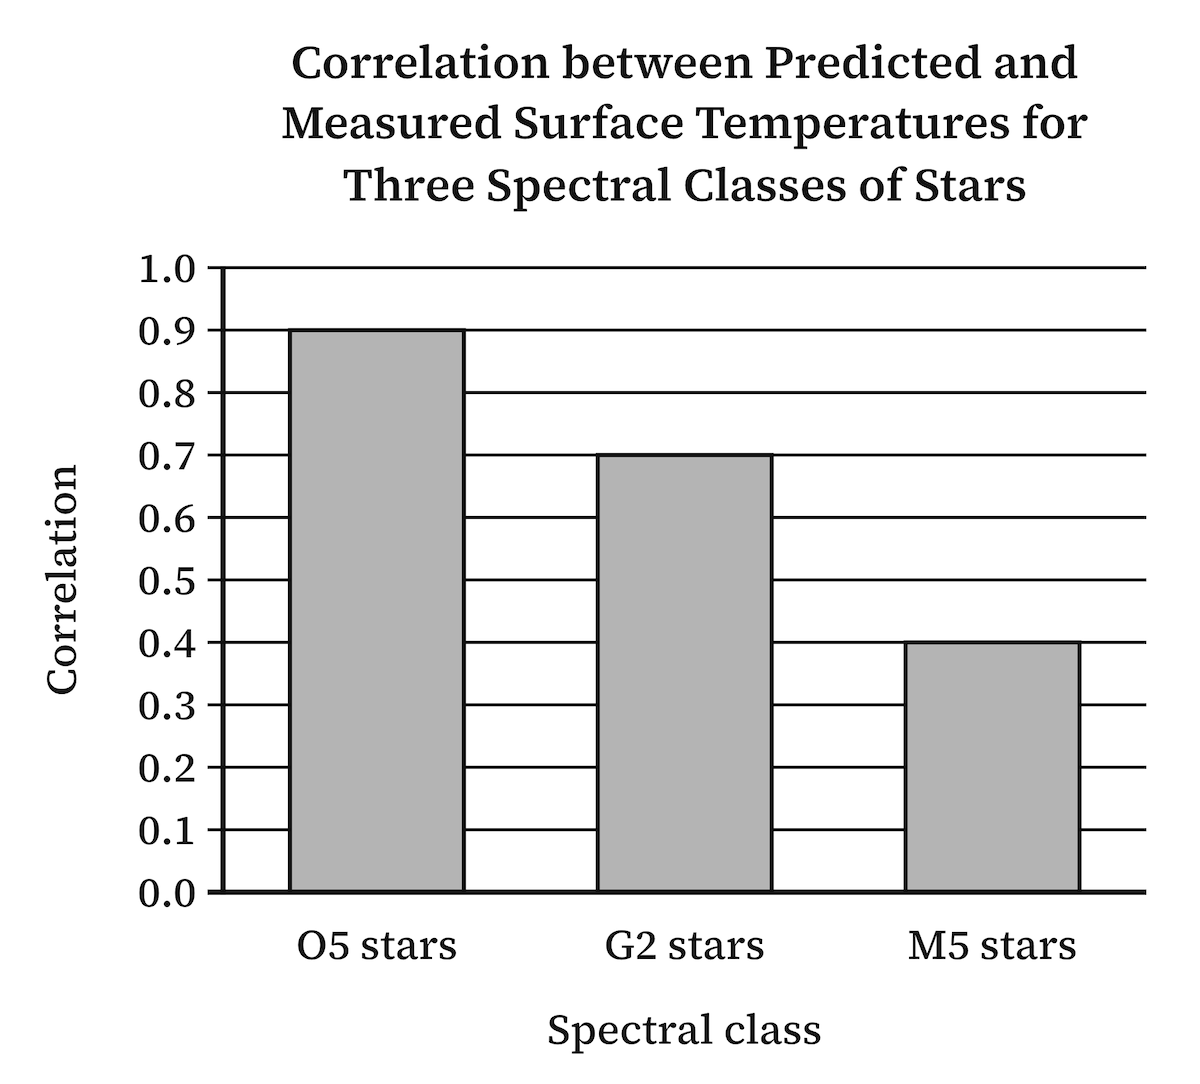
Imagine a graph comparing three types of celestial bodies. The bars show the correlation between predicted and actual values for each type.
A student might look at the tallest bar and conclude that the corresponding celestial body is the most common.
That conclusion is unsupported. The bar represents agreement between the model and the actual measurements, not the number of celestial bodies.
You need to understand the label before interpreting the height of the bar.
Also remember that correlation is not the same as causation. A relationship between two variables does not, by itself, establish that one caused the other.
The SAT may also use the idea of attribution: establishing which factor is responsible for an observed result. Do not assume that a larger value automatically identifies the cause or proves a stronger effect. Read what the graph measures and what the passage claims.
8. Never Assume Graph Labels Mean What You Think They Mean
One of the most dangerous mistakes students make is interpreting a label based on its name rather than the explanation in the passage.
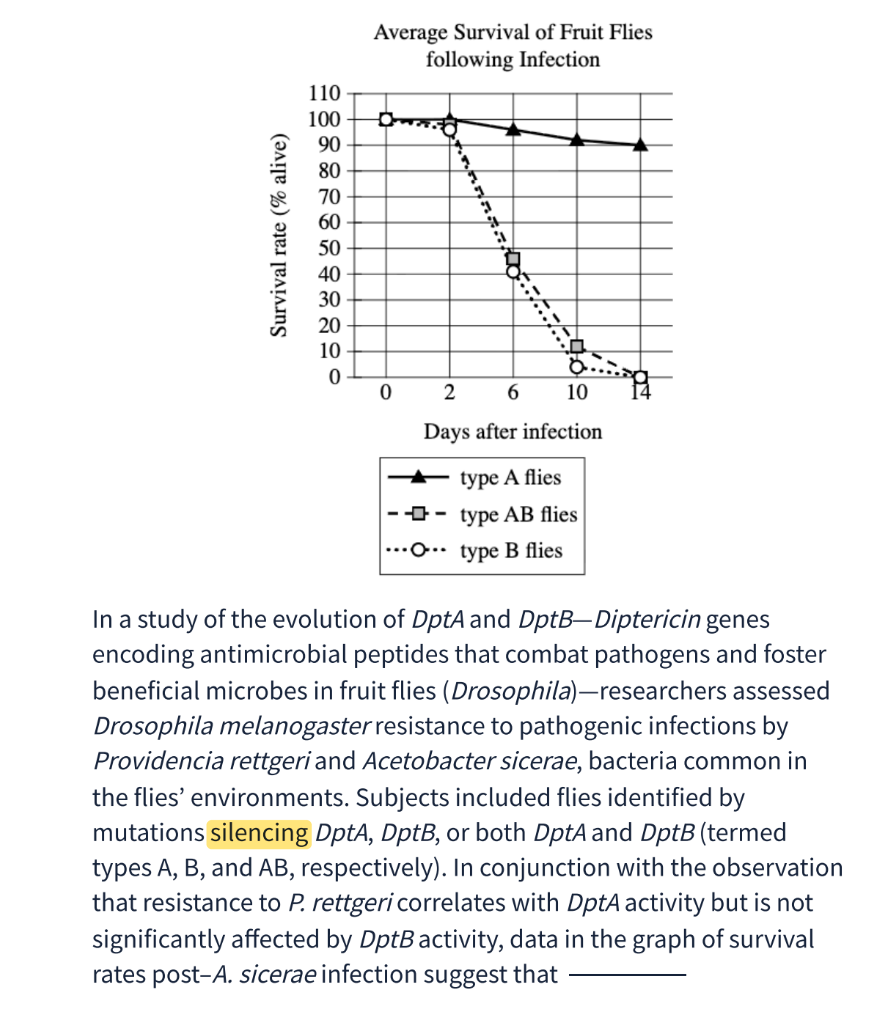
Consider a study involving fruit flies, infections, and two genes, A and B. A graph compares the survival rates of different types of flies.
At first glance, the graph might suggest that type A flies survive longer. A student could easily conclude that gene A provides protection against infection.
But the passage explains something important: the researchers created the groups by silencing certain genes.
A type A fly is one in which gene A has been silenced. That means gene B is the gene that remains active.
Suddenly, the interpretation changes.
The student who assumed that type A flies had gene A active would reach the wrong conclusion. The student who carefully read the passage would understand what the labels actually mean.
This is why you should never treat graph labels as self-explanatory. A label may have a technical meaning that is defined elsewhere in the passage.
When something seems surprising, return to the text and check how the researchers defined their categories.
9. Look for Overall Trends, Not Just the Highest Bars
Another common mistake is focusing only on the most dramatic values.
For example, look at the study of lizard species measuring how much of their maximum speed they use when pursuing prey and escaping predators.
The graph shows that eight species use 90–100% of their maximum speed while escaping predators. That is an interesting result.
But what about all the other species?
If you focus only on the tallest category, you might miss that the remaining species are spread across several lower speed ranges. When you add those categories together, they may tell a very different story.
For example, the data might show that multiple lizard species use less than 90% of their maximum speed even while escaping predators.
That finding could support a statement about how many species do not use their full speed capacity.
The lesson is simple: do not stop at the most noticeable bar or category. Look at the entire distribution.
Ask yourself:
- How many observations fall into each category?
- What happens when I combine the relevant categories?
- Does the overall pattern support the claim?
- Am I focusing on one unusually high value while ignoring the rest?
A graph is more than its tallest bar. You need to understand the pattern across the data.
10. Match the Evidence to the Exact Claim in the Passage
Even when an answer choice is supported by the graph, it may still be wrong.
This is one of the most important distinctions in SAT graph questions.
An answer can accurately describe something in the data but fail to complete the sentence or support the author's specific point.
Return to the lizard example. Suppose the passage argues that lizards may conserve energy rather than always using their maximum speed, even when escaping predators.
An answer choice might correctly state that more lizard species use 90–100% of their maximum speed while escaping predators than use any other individual speed category.
That statement may sound plausible and may describe part of the graph. But it does not support the passage's specific point that multiple species use less than 90% of their maximum speed while escaping predators.
The stronger answer is the one that connects the evidence to the actual claim.
Before choosing an answer, ask:
- Does the graph support this statement?
- Does the passage support this statement?
- Does it answer the question being asked?
All three matter.
Do not select an answer simply because it sounds scientific or describes a real feature of the graph.
11. What to Do When Two SAT Answer Choices Seem Correct
The SAT is designed so that one answer is correct. If you genuinely believe that two choices could work, assume that you have missed something.
Do not simply choose the one that sounds better.
Instead, work through a checklist.
First: Did I misread the question?
Check whether the question asks you to support a conclusion, challenge an assumption, or complete a particular assertion. These tasks are not interchangeable.
Second: Did I misread the passage?
Return to the relevant sentence. Check for definitions, qualifications, and details that may change the meaning of the graph.
Third: Did I misread the answer choices?
Look for subtle differences in wording. Does one choice refer to the number of organizations while the graph shows percentages? Does another compare two measurements when the passage says both should be considered together?
Sometimes the correct answer is neither of the two choices you initially favored.
The goal is not to decide which answer sounds more reasonable. It is to identify exactly why three answers are wrong and one is supported.
12. Practice Explaining Graphs Out Loud
Reading a list of strategies is not enough. You need to practice applying them.
One effective exercise is to look at a graph and explain the study without reading the passage first. This works best when someone is listening and can tell you where your explanation went off track, and that’s the kind of work our tutors at Ivy Tutors Network do with students. We use evidence-based SAT reading strategies. They don’t just check whether you picked the right answer. They listen to how you read the data and help you fix the reasoning behind it.
Start with the title. What is being studied?
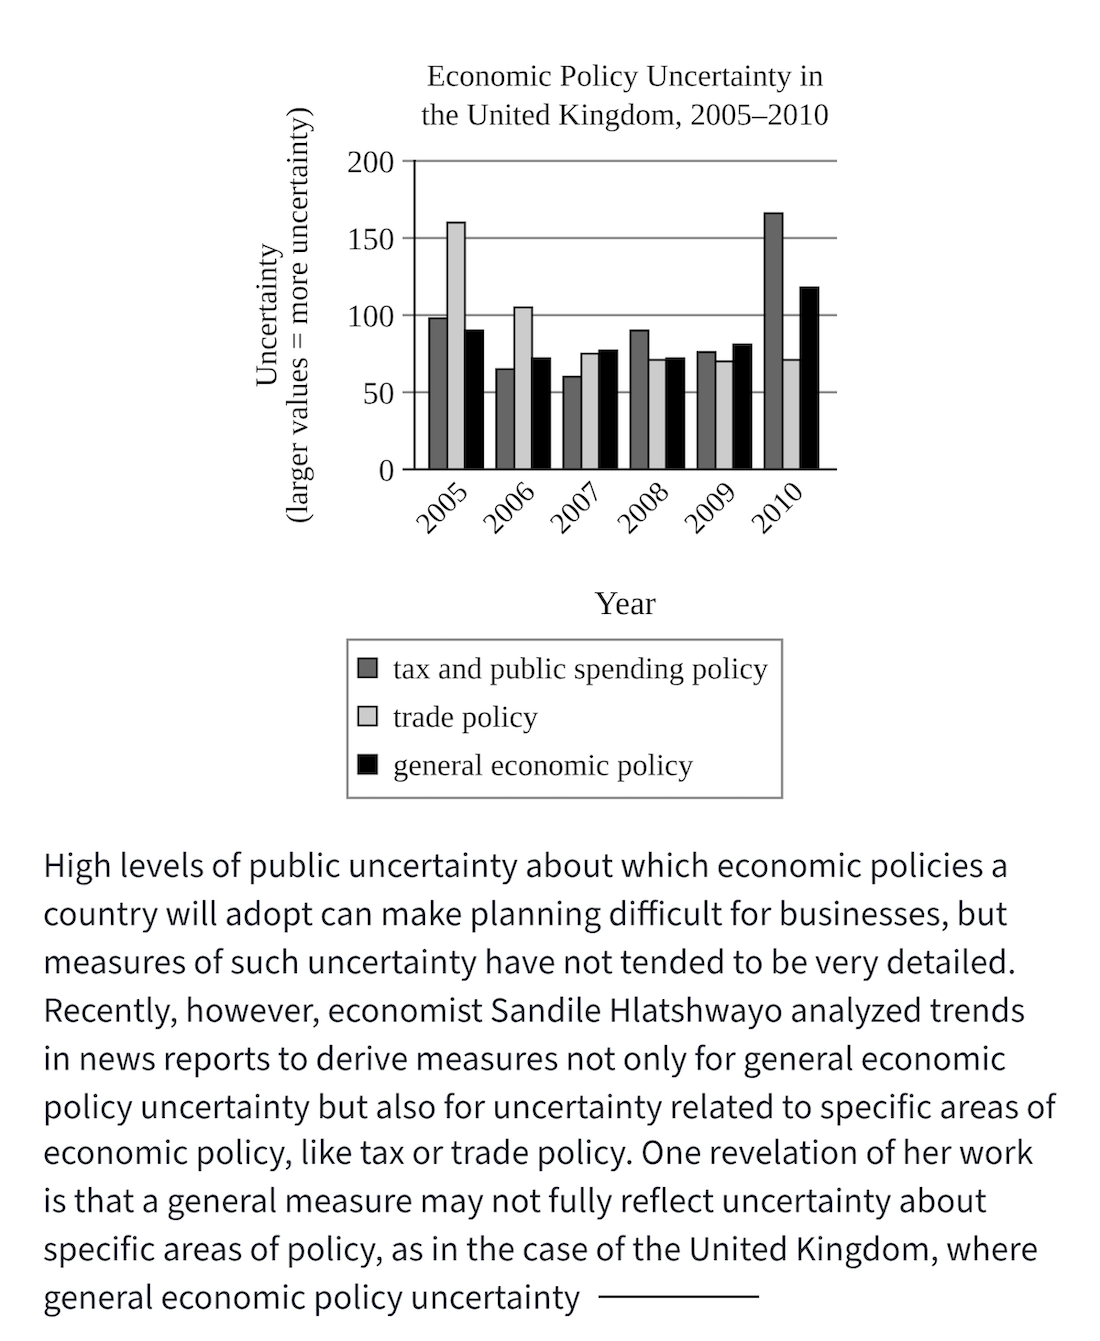
Then identify what the researchers varied and what they measured. Describe the major patterns in your own words.
For example, when looking at a graph about economic policy uncertainty in the United Kingdom, you might identify three categories:
- General economic uncertainty
- Trade policy uncertainty
- Tax and public spending uncertainty
You could then describe what happened in a particular year and compare the categories.
After that, read the passage and see how the author's explanation connects to the data.
This exercise trains you to interpret information independently rather than relying on answer choices to tell you what to notice.
It also helps you identify gaps in your understanding. If you cannot explain what the graph measures, you probably need to look more carefully at the labels or return to the passage.
Most importantly, practice analyzing the incorrect answers. Ask why each distractor is wrong, not just why the correct answer is right.
Conclusion: Master the Method, Not Just the Tricks
Learning how to solve graphs on the SAT ELA requires more than recognizing trends or reading numbers. You need to understand the study, identify its variables, interpret the labels, and connect the evidence to the passage's central claim.
Remember the most important strategies:
- Reconstruct the study before interpreting the data.
- Identify what researchers varied and what they measured.
- Use the question stem as your guide.
- Read labels carefully, especially when they contain technical definitions.
- Watch for reverse trends and unexpected directions.
- Distinguish percentages and proportions from actual quantities.
- Understand what correlation measures before interpreting a bar.
- Look at the overall pattern, not just the highest values.
- Make sure your answer supports both the graph and the passage.
- If two answers seem correct, go back and find what you missed.
Ultimately, improvement comes from deliberate practice. Work through different graph and table questions, explain your reasoning, and analyze every answer choice. The goal is to develop a repeatable method that helps you understand unfamiliar studies, even when the subject matter is complicated.
With the right approach and consistent practice, SAT graph questions become less intimidating and much more manageable.
About the author
Katya Seberson is an educator, published author, and Co-Founder and Chief Academic Officer of Ivy Tutors Network. A perfect scorer on both the SAT and ACT, she has more than 13 years of full-time test prep experience in New York City. She is the creator of the Seberson Method (5BLX), an innovative approach to test preparation, and the driving force behind MockExamApp.com.